Primary Pitching Rate
Final pH and apparent extract of each fermentation was collected and fermentation performance at 12×106 cells/ml was evaluated. The apparent attenuation attained after 35 days was graphed (Fig. 5) and from it four categories emerged based on the level of attenuation per strain. The first category was strains that achieved greater than 70% attenuation. Only B. bruxellensis (BSI-Drie) with a mean value of 73.06% (±1.33%) had attenuation over 70%. The second category of attenuation (70% – 50%) contained two strains, along with the third category (50% – 30%) with two strains. The final category with three strains were the ones that had less than 30% apparent attenuation. Apparent attenuation of all eight strains was plotted against the matching final pH and a linear best-fit line was applied (Fig. 6). The pH appears to have a correlated effect on the apparent attenuation of each strain.
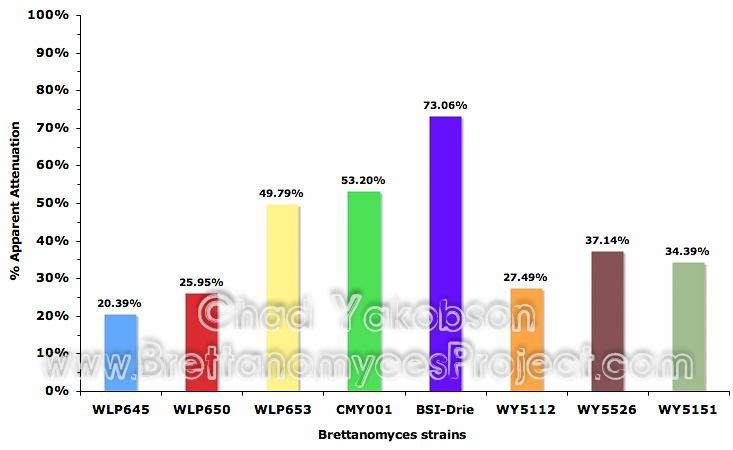
Figure 5. Apparent Attenuation (%) of eight strains of Brettanomyces after 35 days of primary fermentation. Inoculated with a pitching rate of 12×106 cells/ml.
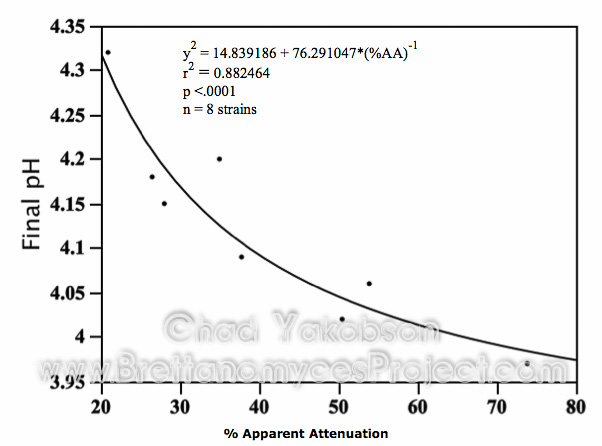
Figure 6. Apparent attenuation (%) and its dependence on final pH during primary fermentation with eight strains of Brettanomyces. Fermentations were inoculated with single strains at a pitching rate of 12×106 cells/ml and fermented for 35 days.
Quantitative Analysis
Volatile compound analysis, performed after 35 days of pure culture fermentation with a pitching rate of 12×106 cells/ml, showed high variability in the eight Brettanomyces strains abilities to utilize wort sugars (Fig. 7). The two most peculiar strains were B. lambicus (WLP653) and B. bruxellensis (WY5112), which had measurable amounts of glucose, fructose and sucrose. B. lambicus (WLP653) had mean value 6.11 g/l (±1.98) of glucose, 0.62 g/l (±0.09) of fructose, and 2.41 g/l (±0.38) of sucrose remaining in solution while having utilized 51.63 g/l (70.9%) of the sugar maltose and 2.44 g/l (13.2%) of maltotriose. While a general decrease of fermentable sugars was seen in all the fermentations, B. bruxellensis (WY5112) had 2.83 times (18.36 g/l) more glucose than was analyzed in the initial wort concentration, with 1.39 times (0.69 g/l) more fructose observed and 1.02 times (0.4 g/l) more maltotriose. In the other six strains glucose, fructose and sucrose were completely consumed with only maltose and maltotriose still present. B. bruxellensis (BSI-Drie) had the greatest utilization of fermentable sugars, consuming 92% (67.03 g/l) of the maltose initially present, and its utilization of maltotriose at 47.6% (8.77 g/l) was the highest among all the strains. Compound analysis were conducted to observe the characteristic compounds produced by eight Brettanomyces strains when inoculating with 12×106 cells/ml. Out of seven esters analyzed, ethyl acetate, ethyl caproate and ethyl caprylate were the only compounds present above threshold levels.
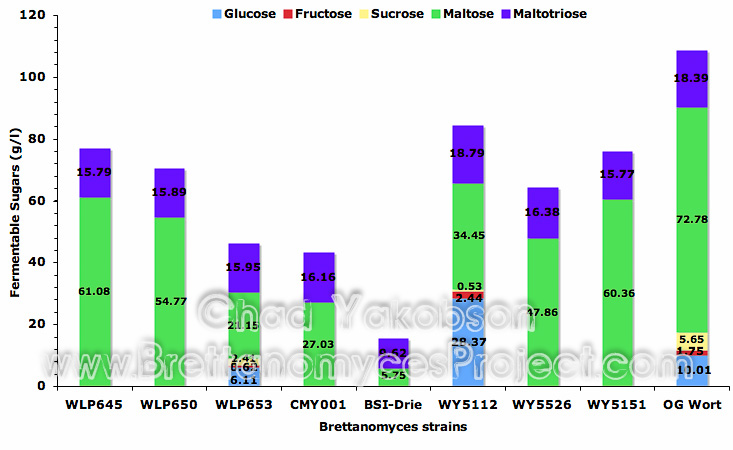
Figure 7. Mean fermentable sugars (g/l) present after primary fermentation with eight strains of Brettanomyces. Primary fermentations were conducted with a pitching rate of 12×106 cells/ml and given 35 days to ferment. Original gravity wort is shown as reference for initial sugars present.
Ethyl acetate production (Fig. 8) was highly variable with only one of seven strains producing threshold levels above 30 mg/l (Meilgaard, 1975b). B. bruxellensis (BSI-Drie) had the highest production level (mean value 35.8 mg/l ±6.3) while the second highest with a mean value of 16.76 mg/l (±1.76) was B. bruxellensis (CMY001). The lowest ethyl acetate producing strain was B. claussenii (WLP645) with a mean value of 1.26 mg/l (±0.01). Ethyl lactate with a threshold level of 250 mg/l (Meilgaard, 1975b) was observed in each fermentation at levels below 2 mg/l (Fig. 8).
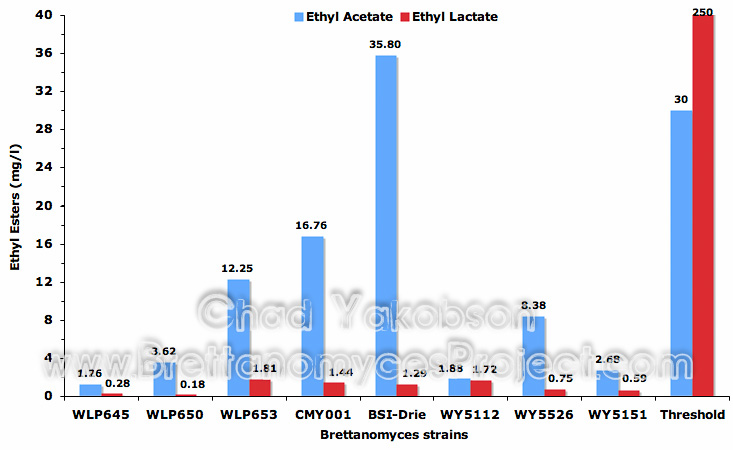
Figure 8. Mean ethyl acetate and ethyl lactate (mg/l) formed during 35 days of pure culture fermentation with eight strains of Brettanomyces and a pitching rate of 12×106 cells/ml.
Ethyl caproate production (Fig. 9) was less variable with 50% of the strains producing threshold levels above 0.21 mg/l (Meilgaard, 1975b). The ability to produce ethyl caproate above threshold levels appeared to be strain type related as the B. lambicus strains (WLP653 & WY5526) produced mean values of 0.25 mg/l (±0.002) and 0.29 mg/l (±0.01) respectively, along with B. bruxellensis (CMY001 & BSI-Drie) which produced 0.36 mg/l (±0.04) and 0.39 mg/l (±0.13) respectively. B. bruxellensis (BSI-Drie) had the highest quantity out of the strains, producing 1.86 times the perceived threshold level. B. claussenii strains (WLP645 & WY5151) formed the lowest amount of ethyl caproate, with no detectable amount found from B. claussenii (WLP645) and 0.04 mg/l (±0.002 mg/l) present in B. claussenii (WY5151).
Ethyl caprylate was the predominant ester produced during fermentation by five of eight strains (62.5%) at threshold levels above 0.9 mg/l (Meilgaard, 1975b). As can be seen from the graph (Fig. 9) compound levels ranged from 1.5 times to 4.6 times the perceived threshold levels. B. lambicus (WLP653) with a mean value of 4.13 mg/l (±0.09) had the highest measurable amounts while the other B. lambicus (WY5526) formed the lowest amount still above threshold (mean value 1.34 mg/l ±0.02). B. bruxellensis (CMY001 & BSI-Drie) both formed modestly high amounts with 3.35 mg/l (±0.15) and 3.0 mg/l (±0.92) produced respectively. Again it was observed that both B. claussenii strains (WLP645 & WY5151) did not produce significant quantities of the ester ethyl caprylate.
Isoamyl acetate and isobutyl acetate esters were analysed with no detectable amounts being produced by any of the Brettanomyces strains. Ethyl butyrate was also analyzed (Fig. 9), and while four of the strains produced detectable levels, none were near the perceived threshold level of 0.4 mg/l (Meilgaard, 1975b).
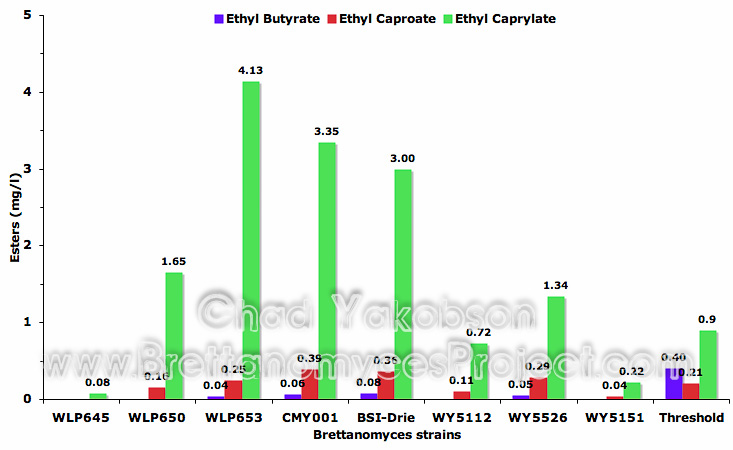
Figure 9. Mean ester compounds (mg/l) formed during 35 days of pure culture fermentation with eight strains of Brettanomyces and a pitching rate of 12×106 cells/ml.
Four higher alcohols were analyzed from the fermentations (Fig. 10) with none of the strains producing levels near the perceived threshold.
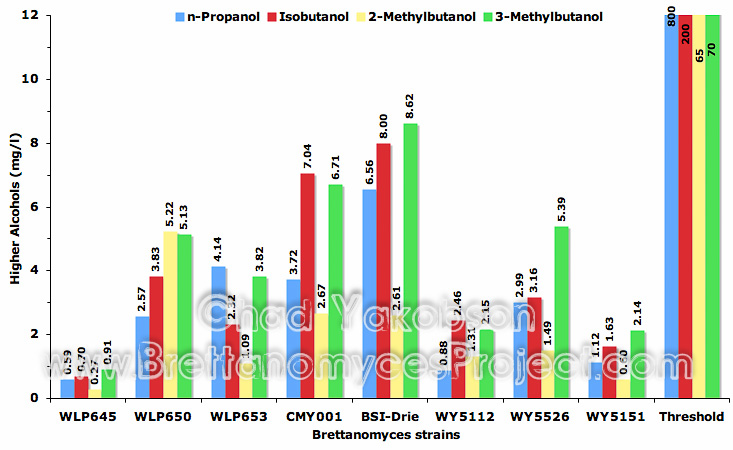
Figure 10. Mean higher alcohol compounds (mg/l) formed during 35 days of pure culture fermentation with eight strains of Brettanomyces and a pitching rate of 12×106 cells/ml.
The levels of 4-vinylphenol and 4-vinylguaiacol were analyzed and the levels produced during pure culture fermentation were measured. While 4-vinylphenol was not detected in any of the eight strains during fermentation, low levels of 4-vinylguaiacol were (Fig. 11), with no strains producing amounts above threshold levels (0.3 mg/l) as found by Meilgaard (1975b). The levels of volatile phenolic compounds present after fermentation were variable between strains and did not correlate to the level of attenuation observed in the strains.
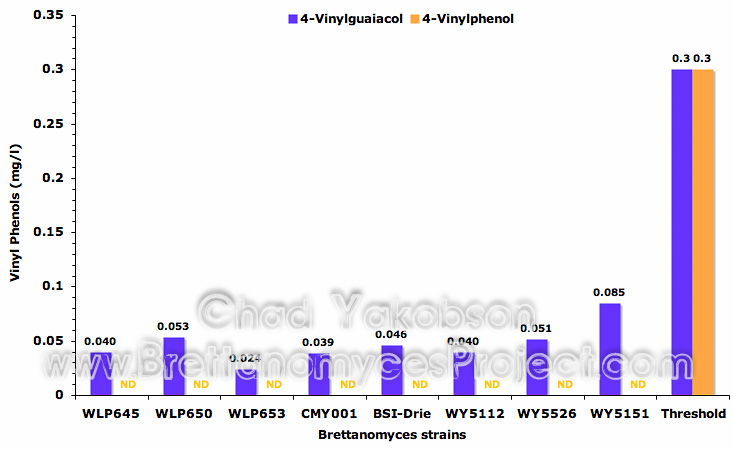
Figure 11. Mean vinyl phenols (mg/l) formed during 35 days of pure culture fermentation with eight strains of Brettanomyces and a pitching rate of 12×106 cells/ml.
The final three compounds analyzed from the fermentations were acetaldehyde and the vicinal diketones, diacetyl and 2,3-pentanedione. Acetaldehyde was observed to be consistent between strains with mean values between 1.98 mg/l (BSI-Drie) on the high end and 0.8 mg/l (WY5112) on the low end. Diacetyl was present below threshold levels in seven of the eight strains (Fig. 12). B. lambicus (WLP653) fermentations had diacetyl present 1.46 times (mean value 0.22 mg/l ±0.05) the threshold level recognized as 0.15 mg/l (Meilgaard, 1975b). 2,3-pentanedione was analysed at 50-300 times below the perceivable threshold level.
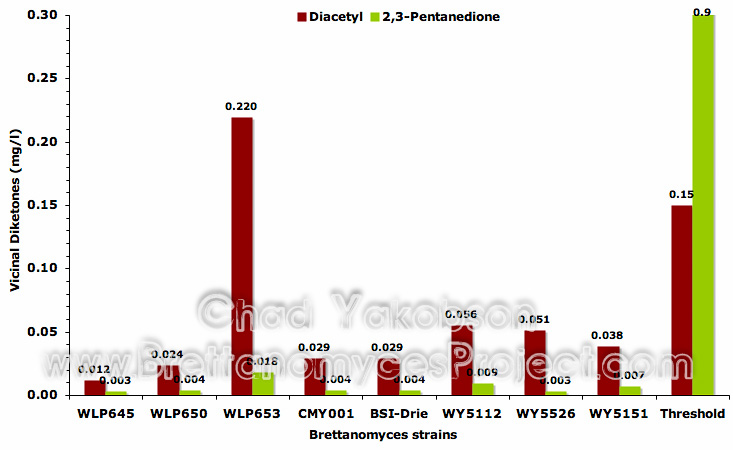
Figure 12. Mean vicinal diketones (mg/l) formed during 35 days of pure culture fermentation with eight strains of Brettanomyces and a pitching rate of 12×106 cells/ml.
Multiple Pitching Rates
Two additional pitching rates of 6×10⁶ and 18×106 cells/ml were chosen to observe the impact initial cell concentration had on pure culture fermentations using four strains of Brettanomyces. Results based on changes in attenuation (Fig. 13) varied between strains with B. bruxellensis (WY5526) and B. claussenii (WY5151) having their highest attenuation at 12×106 cells/ml. B. bruxellensis (BSI-Drie) achieved a high apparent attenuation of 82.16% (±0.004) with 6×10⁶ cells/ml and observed a loss of 17.92% in apparent attenuation as pitching rate was increased to 18×106 cells/ml (mean value of 64.24% ±0.007). However, it was observed that B. bruxellensis (CMY001) had a steady increase (8.68%) in apparent attenuation as pitching rate increased from 6×10⁶ cells/ml to 18×106 cells/ml.
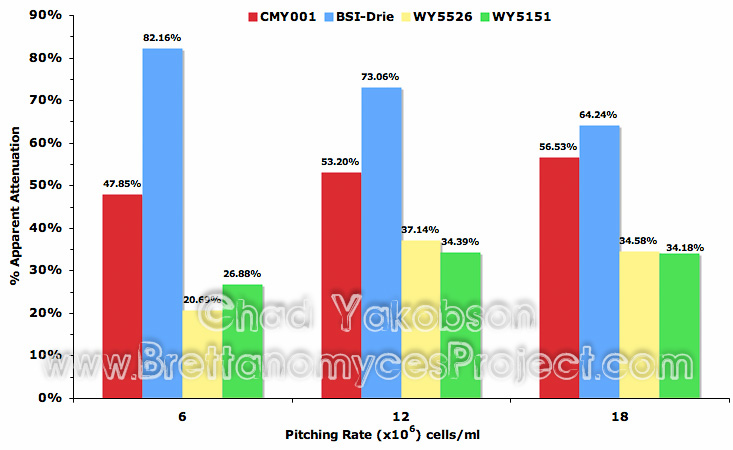
Figure 13. Impact of pitching rate (6, 12, and 18×106 cells/ml) on apparent attenuation (%) with four strains of Brettanomyces after 35 days of pure culture fermentation.
Quantitative Analysis
Sugars present after 35 days of fermentation with different pitching rates found glucose, fructose, and sucrose were completely utilized by all 4 strains. Maltose and maltotriose levels present in the fermentations were not indicative of the level of attenuation observed (Fig. 14). B. lambicus (WY5526) had less available sugars present in fermentations conducted with 18×106 cells/ml then fermentations conducted at 12×106 cells/ml. This is contrary to the measured apparent attenuation as a greater attenuation was observed in fermentation with a pitching rate of 12×106 cells/ml then a pitching rate of 18×106 cells/ml.
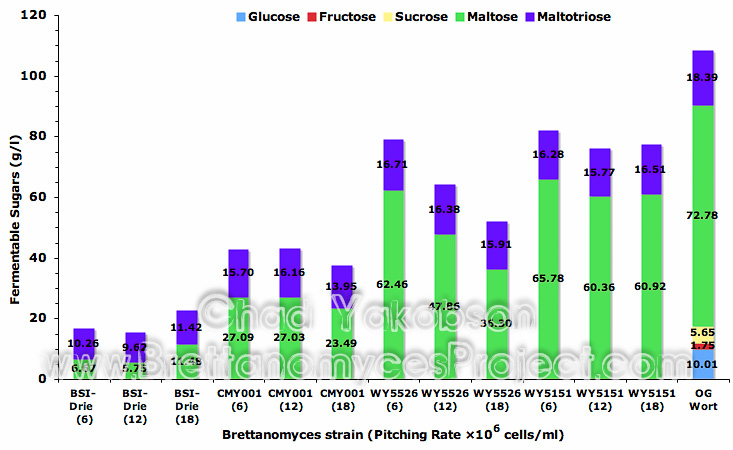
Figure 14. Mean fermentable sugars (g/l) present after primary fermentation with four strains of Brettanomyces. Fermentations were inoculated with a pitching rate of 6, 12, and 18×106 cells/ml and given 35 days to ferment.
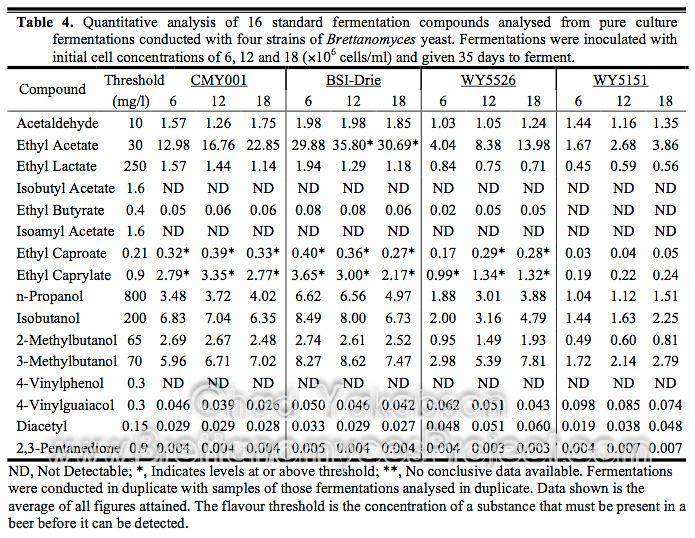
Discernible changes in fermentation compounds were observed with different pitching rates (Table 4). No correlation existed between apparent attenuation and compounds produced, only patterns of increasing and decreasing production of compounds dependent on strain type and pitching rate. For B. bruxellensis (BSI-Drie) a general decrease in compounds was observed as pitching rate was increased. For the strains B. lambicus (WY5526) and B. claussenii (WY5151) an increase in compounds was observed correlated with the increase in pitching rate. The exception was a decrease in ethyl lactate and 4-vinylguaiacol. The changes observed with B. bruxellensis (CMY001) was an increase followed by an equal decrease in compounds produced during fermentation as pitching rate was increased. No detectable amounts of isobutyl acetate or isoamyl acetate were observed in any of the fermentations, while ethyl butyrate had nearly constant below threshold levels of production in three of the four strains with the fourth strain having no detectable levels. The only significant change in compound production, observed in all four strains, was the reduction of 4-vinylguaiacol as pitching rate was increased.

